2019-10-22
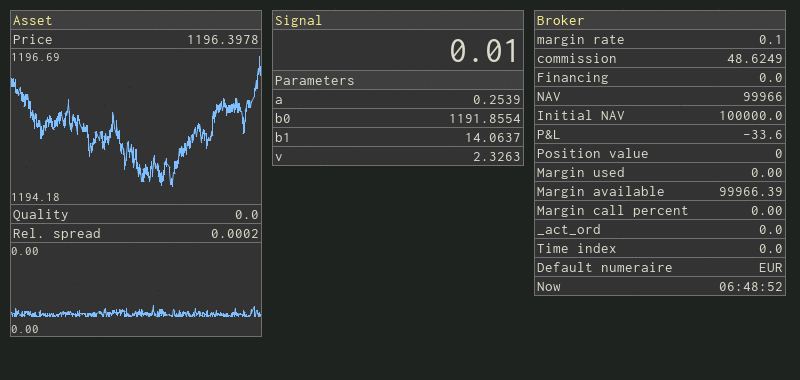
Recently I’ve spent some time coding a dashboard for my algo trading system and I am quite happy with the result:
What’s a bit unusual about this project is the use of pygame (https://www.pygame.org), a Python game development package, instead of a web-based dashboard library (like Dash or Bokeh) or a GUI framework.
Pygame is a wrapper around the SDL library (http://www.libsdl.org/). It is super-simple and easy to learn and fun to work with. It doesn’t offer any standard GUI elements like buttons or windows, but it is surprisingly easy to write those from scratch.
In this post, I go over some basics of pygame for non-interactive use (no user interaction) and show how to use that small subset of pygame features to develop a (static) dashboard displaying some text and plots. By static dashboard, I mean that positions of all GUI elements are defined in the code and e.g. those windows on the dashboard snapshot above cannot be moved at run-time.
Initialize pygame and get the screen surface:
import pygame
pygame.init()
screen_surface = pygame.display.set_mode((120, 80))
pygame.display.flip()
A surface is a bitmap and it’s a fundamental concept in pygame.
Essentially, a pygame app defines multiple surfaces, modifies their
content (pixels) and copies one surface onto another. This resembles
playing with multiple sticky notes of different sizes. A screen surface
is linked to the pygame window at run-time. We can update that window
using the pygame.display.flip() method. For example, let’s
fill the screen surface with a color and update.
color_fg, color_bg = pygame.Color(0xfff31bff), pygame.Color(0x1e2320ff)
screen_surface.fill(color_bg)
pygame.display.flip()
# changing the bg color visible
Create a surface:
width, height = 20, 20
another_surface = pygame.Surface((width, height))
another_surface.fill(color_fg)
Every surface has a width and a height:
w, h = another_surface.get_width(), another_surface.get_height()Blitting (copying) one surface onto another:
where_x, where_y = 10, 10
screen_surface.blit(another_surface, (where_x, where_y))
Text and fonts:
font_name, font_size = 'inconsolata', 32
font = pygame.font.SysFont(font_name, font_size)
text_surface = font.render('A', True, color_fg, color_bg)
screen_surface.blit(text_surface, (65, 57))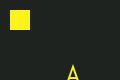
Draw an (anti-aliased) line from the lower-left corner to the upper-right corner of the screen surface:
x_y_tuples = [(0, 79), (119, 0)]
pygame.draw.aalines(screen_surface, color_fg, False, x_y_tuples)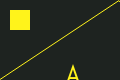
That’s all we need to know about pygame to write a simple dashboard.
To create a dashboard shown at the beginning of the post, I wrote a
small (~300 loc) python module which I called periscope
(https://github.com/jwergieluk/periscope). It contains two content
widgets, TextField and LinePlot, and two
container widgets HStack and VStack. All of
those classes inherit from the Widget class that exposes
the attributes w (width) and h, and the
surface property. Also, the widgets implement both the
observer and observable patterns and update their surfaces lazily. The
contents of TextField and LinePlot widgets can
be updated using the set_content method.
The appearance of all the widgets is parametrized flexibly. In the
following I illustrate some basic usage, leaving most parameter values
at their defaults. The images below are generated by dumping the
surface properties to disk.
The first argument sets the (fixed) width of the widget. The height is derived from the font size.
text_field_0 = TextField(250, 'Text field with width 250')
x = np.linspace(0.0, 2*np.pi, 100)
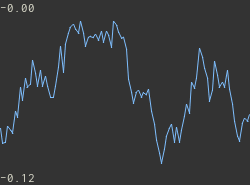
line_plot_0 = LinePlot(120, 80)
line_plot_0.set_content(x, np.sin(x))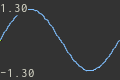
LinePlot smoothly updates the y-axis limits on each call of
set_content method:
Define three text fields and put them into a horizontal stack and a vertical stack container. Note that updating the content of the second text field propagates to both stacks.
text_field_1 = TextField(90, 'TextField1')
text_field_2 = TextField(90, 'TextField2')
text_field_3 = TextField(90, 'TextField3')
h_stack = HStack([text_field_1, text_field_2, text_field_3])
v_stack = VStack([text_field_1, text_field_2, text_field_3])
text_field_2.set_content('Field2')

Executing the periscope module from the command-line
shows an example dashboard with some random data.
python periscope.pyperiscope GitHub repo: https://github.com/jwergieluk/periscope