2019-03-03
TensorboardX is a tool for monitoring “jobs” that produce numerical data as they run. Originally developed to visualize training progress of deep learning models in PyTorch, it builds on top of Tensorboard which is a part of Tensorflow. Nevertheless, TensorboardX stands for “Tensorboard for X” where X could be any type of long-running number-crunching job we want to monitor.
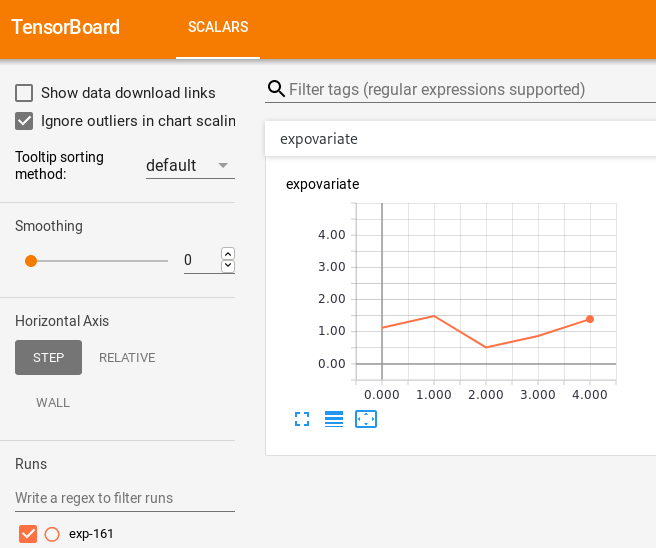
The following script creates a new run directory and saves some samples of a scalar random variable.
import tensorboardX
import random
import time

run_id = random.randint(0, 1000)
sink = tensorboardX.SummaryWriter(f'runs/exp-{run_id}')

for i in range(120):
    obs = random.expovariate(1.0)
    sink.add_scalar('expovariate', obs, i)
    time.sleep(1)
The tensorboard server operates as an independent process:
$ tensorboard --logdir runsThe web dashboard updates every 30 seconds and looks really slick:
Another feature that caught my attention is the
add_histogram method that expects a numpy vector and
produces a stacked histogram plot (also called a waterfall plot).
import tensorboardX
import random
import time
import numpy.random

run_id = random.randint(0, 1000)
sink = tensorboardX.SummaryWriter(f'runs/exp-{run_id}')

for i in range(1, 10):
    sink.add_histogram('hist-1',
            numpy.random.gamma(shape=i, scale=4.0, size=1000), i)
    time.sleep(1)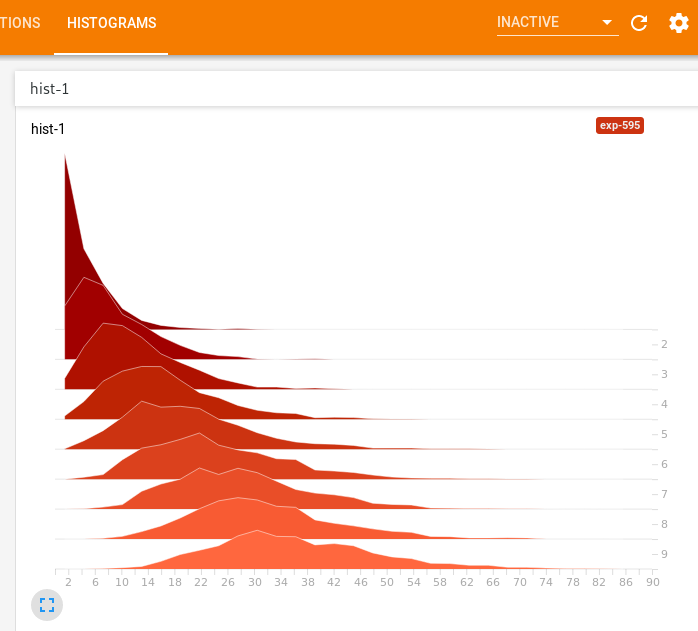
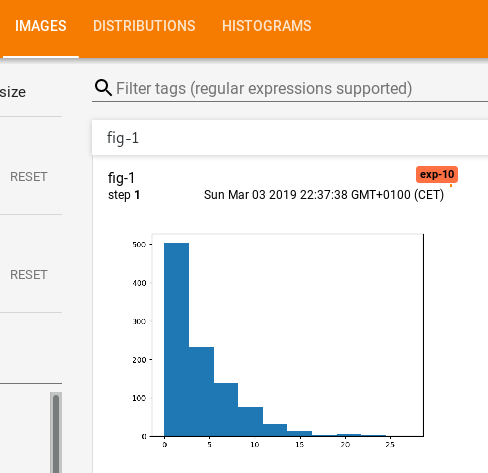
Finally, it is equally easy to push an arbitrary matplotlib figure:
import tensorboardX
import random
import time
import numpy.random
import matplotlib.pyplot as plt

run_id = random.randint(0, 1000)
sink = tensorboardX.SummaryWriter(f'runs/exp-{run_id}')

for i in range(1, 10):
    data = numpy.random.gamma(shape=i, scale=4.0, size=1000)
    fig = plt.figure()
    plt.hist(data, bins=10)
    sink.add_figure('fig-1', fig, i)
    time.sleep(1)
    plt.close()
The figures produced by our code are converted to images and presented on the board:
There is a similar tool from Facebook Research called Visidom1. My impression is that Visdom is more heavy-weight because the produced dashboard is served directly from the Python application, but offers interactivity via callbacks and more flexibility through the plot.ly backend.
Clearly, there are more powerful general-purpose tools for creating dashboards, e.g. Bokeh or Dash. TensorboardX offers stunning simplicity and ease of use geared towards model development and rapid prototyping.
Interested? Read the docs: https://tensorboardx.readthedocs.io/en/latest/tutorial.html